This post is about setting up testing for TypeScript with Jasmine in Visual Studio, but it should be pretty much the same using QUnit.
To set this up, start a new MVC project and let’s get Knockout and Jasmine installed into the project, along with their TypeScript definitions:
Install-Package knockoutjs
Install-Package knockout.typescript.DefinitelyTyped
Install-Package JasmineTest
Install-Package jasmine.typescript.DefinitelyTyped
We’re using the Jasmine Nuget package called JasmineTest. There is a similar one on Nuget called Jasmine-JS, the difference being that JasmineTest will add a controller and view to let you run your tests. We’ll be using that in a second to let us debug the tests. Now run and browse to ~/jasmine/run and you’ll see this:
This is the view added by the JasmineTest package. It is an HTML page (SpecRunner.cshtml) and has the references for the example Jasmine specs that ship with Jasmine. We are going to be using to let us debug out tests.
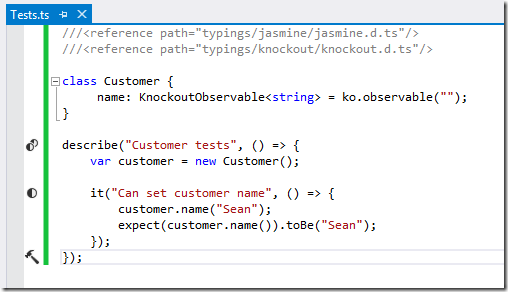
So, let’s write some tests. For simplicity we’re going to put the model and the tests into the same file. So we add a TypeScript file called Tests.ts to your /Scripts folder and add the following lines to that file, giving this:
Running tests with ReSharper
If you have ReSharper installed, then the R# Test Runner will recognise the Jasmine test and allow you to run them. To set this up for a smooth experience, first install PhantomJS and set the path to phantomjs.exe in Resharper | Options | Tools | Unit Testing | JavaScript Tests.
R# will need to find the .JS files for the .TS references. R# will look for and use a file that is named the same as the Definitely Typed TS file, but ending with .JS. For us, this means copying knockout-3.1.0.js from /Scripts to /Scripts/typings/knockout and renaming it to knockout.d.js:
After that you can just run the tests as you would in C#:
Running tests with Chutzpah
You can also use the Chutzpah test runner to run Jasmine tests in Visual Studio. You can install that from Tools | Extensions and Updates here:
Once installed, you just right click the TypeScript file that contains the tests and select the item Run JS Tests. This puts the test results into the Visual Studio Output window by default, but there is a Visual Studio extension that gives integration with the Visual Studio Test Explorer.
If you go ahead and run the tests as shown above you’ll get an error. This is because Chutzpah resolves referenced JS files differently to R#. For this to run, we need to add a reference to the JS file in the TS test for Chutzpah to pick up. This is documented here and looks like this:
/// <chutzpah_reference path="knockout-3.1.0.js" />
Debugging tests in Visual Studio
As far as I can tell, there is currently no support from either R# or Chutzpah for debugging TS tests from either test runner in the IDE. However, we can do that by going back to our SpecRunner.cshtml that was installed with the JasmineTest Nuget package.
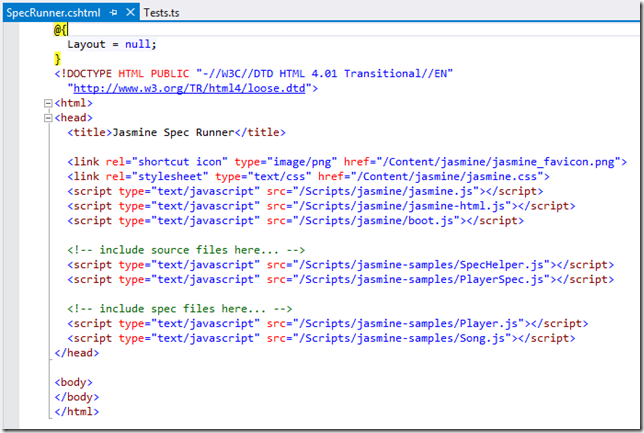
Just add the JS references along with a reference to our test file to the HTML shipped with the package:
Note that we are referencing Tests.js instead of the TS file. Then place a break point in the test in the TS file, run a browse to ~/Jasmine/Run:
Job done! Source code is here: https://bitbucket.org/seankearon/typescript-testing-in-studio


4 comments:
Hi Sean,
Thank you for sharing this info. I was particularly interested in debugging test using VS. Unfortunately, this is the part I was not able to do. Could you please clarify further, what one must do?
There are my thoughts on what is going on.
Obviously, to be able to debug any piece of code, a debugger must be attached to the process running it. In our case, we must attach to a browser we use to open the page (and that browser must support script debugging). However, in your blog post there is no mentioning of attaching to anything, and by default Visual Studio only attaches to IIS (when you hit F5).
Anyway, I tried to enable script debugging in IE (disabled by default), attaching to IE, opening the page in it, but the breakpoint did not hit. What did I do wrong?
Thanks!
Update:
I was able to stop on a breakpoint set in javascript file (Tests.js) after I manually attached to IE. Is there any additional steps to enable TS debugging?
Apparently, one has to use at least Update 3 for VS2013 (given that they use VS2013, don't know about other versions)
Hi Eugene
As I remember, it just worked and was awesome.
Since then I've spent more time in pure JS and using Chutzpah to run the tests in the browser and then Chrome dev tools to debug things. Not as awesome, but still a pretty good option.
Have you got it working now then?
Cheers
Sean
Post a Comment